
How I built three research tools with AI in one evening
Part two of three on improving as an investor with AI tools
I’ve talked to a lot of investors about using new AI tools (Claude Code and Cowork) in investing (particularly on the heels of my “Basics for using Claude Cowork with investing” post). The investors I talk to generally fall into three buckets:
They’re still using AI the same way they were in the middle of 2025 (as a hybrid super Google + senior analyst for research reports) or not using AI at all (the “no AI” group tends to be older, but not always).
They’re using AI to do fundamental diligence that was previously either impossible or would have required an enormous research budget.
They’re using AI to develop custom tools to make their lives easier.
The tools can be pretty broad: automating tasks they used to perform by hand, gathering unique data, etc.
Today, I want to walk you through what a lot of my own work has looked like: building light little tools to do diligence that was previously either impossible to perform or required incredibly expensive consultants and subscriptions. Call it bucket #2.5 given it blends #2+3. The line between using AI to do diligence and using AI to build a tool that does diligence turns out to be very blurry once you actually start doing it.
Why am I writing this post? Two reasons. First, I’m a mensch, and I think the best way to convince you these tools are useful is to show you exactly how I built a few…. Second, I’m also selfish. If you're reading this post and thinking “this dummy is doing everything wrong,” or if you'd just like to swap notes on using AI in investing, I'd love to hear from you. I'm still in the “play” stage of the learning curve, and most of what I'm picking up comes from doing random little projects to find out where the tool breaks or discover new capabilities.
Here's the point of this entire post in one sentence: with maybe an hour of fiddling, you can now build research tools that two years ago would cost tens of thousands a year as a data subscription, or that didn't exist at all. Once you start playing around with what you can build, you can perform all sorts of fundamental “checks” that previously would have been virtually impossible. And it takes almost no skills; I have no coding or tool building background, and I’m still generating interesting projects and tools almost as fast as I can think them up.
So let’s turn to tool building. I think one of the tricks to AI is you don’t just want to go build a tool for no reason; you want to build tools to help you with specific questions or diligence points you have. For this post, I’m going to start from scratch and build three tools alongside the post that will help you follow along with the process1. The three tools are:
A tool that lets you follow Sweetgreen’s Yelp ratings over time
A price comparison tool for Sweetgreen versus its closest Just Salad competitor
A price comparison tool that prices Cable One’s broadband offering against their fiber competitor on a market-by-market basis
And remember: the beauty of these tools is that once you build them, it’s pretty simple to switch their outputs. So maybe a Sweetgreen tracker isn’t for you…. but it’s pretty simple to switch it to a McDonalds tracker, or price compare Target to Walmart, or whatever else fits what you’re specifically interested in.
So why’d I chose Sweetgreen (SG)? I’ve been loosely following it for a while. I’ve had a few friends pitch the stock to me with a basic “Chipotle 2.0” thesis: Sweetgreen is a category killer for salads2, the current issues are overblown, and once they pass you get enormous upside as the market will quickly come to reward Sweetgreen’s long growth runway with a premium multiple.
Despite the inbounds and a stock chart that is admittedly very attractive to the garbage hunter in me…..
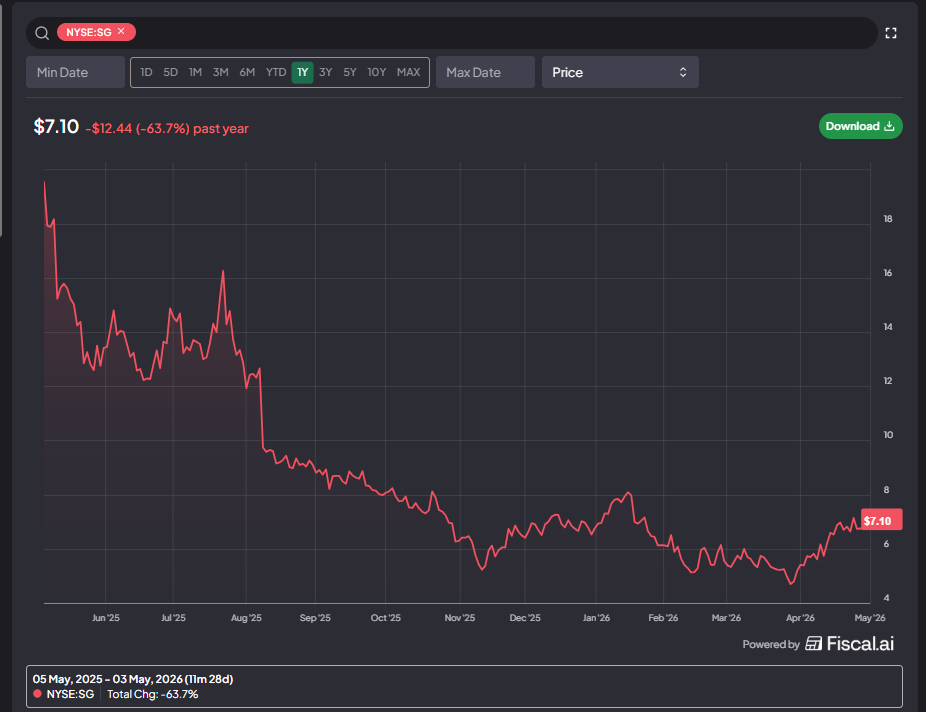
I haven’t been that interested in Sweetgreen for two main reasons:
Good restaurants tend to make their money on the “extras”: drinks, sides, desserts. Sweetgreen’s model doesn’t lend itself well to selling any of those high margin products.
I’m an avid SG customer; when I’m really trying to buckle down with my weight, I probably eat Sweetgreen 5-6 times a week. When I’m being a little looser with my weight (and my belt loop), I still eat there ~2x a week. And, as an avid customer, I feel like Sweetgreen’s customer service has gone noticeably downhill over the past six months.
Number two is what I like to call “personal anecdata,” and it can be very dangerous: just because you have an experience or feeling does not mean it’s right!
The way to use anecdata is to try to find real data to either back up the anecdata or disprove it. So, for Sweetgreen, perhaps we could track all of the Yelp scores of every location over the past year to see if they’re steady, improving, or declining.
There are already tools that do this: I believe M Science, YipitData, and Thinkum all provide a similar service. But those tools are pretty pricey3! Could you “vibe code” something on these lines and save yourself a mini-fortune in research budget?
I set out to find out. Here’s what I asked Claude:
I’m considering investing in Sweetgreen; however, anecdotally, I’ve noticed that their service has declined dramatically over the past year.
I’d like to build a tool that tracks yelp reviews for every Sweetgreen restaurant daily, averages them, and then provides an overall score for sweetgreen on a daily basis that it charts over time.
So, for example, if Sweetgreen has two restaurants, this tool would find each of their locations yelp pages, look at the reviews every day, average them (so if one restaurant got 20 5 star reviews and 1 got 20 1 star reviews, the chain would average to 3), and do the same thing going back every day for two years. It would then put that on a line chart so i could see how the rating evolves over time (perhaps using an average 7 day rolling score?).
I think the tool should also give me the breakdown of restaurants every day (i.e. I could look at a day and it would say three restaurants averaged 3.8 today, two averaged 4, one averaged 2, etc).
The ideal output would be a widget that opens an html file in a browser.
Is this doable? how would you go about structuring this project? Feel free to use chrome if it helps; if you have a good structure in place, you are free to generate a minimum viable project for me to review and iterate on, but feel free to ask clarifying questions if it would be helpful
Claude ran for ~10 mins and gave me a python file…. but I didn’t want to run a python file because I’m incompetent, so I asked Claude, “Is there a way to do this without Python? Perhaps an HTML that I can open in a browser?” Here’s what it gave me:
Pretty cool, right? But the tracker kind of misunderstood me; I wanted a rolling average that dropped scores after 7 days, not a rolling average of cumulative results for 7 days. So I just told it:
this is very close to right, but not quite.
when i said weighted average, I meant I wanted to drop reviews that weren’t in the time window. So, for example, if someone gets a four-star review on April 10th, that review would count for 7 days (from April 10 to ~April 17th), and then it would drop out. That way i can get an up to the minute review of how the chain is doing.
That resulted in too few results (turns out people don’t rate sweetgreen a ton!), so I had the tool switch weighted average to 45 and 180 days. Here’s what I got:
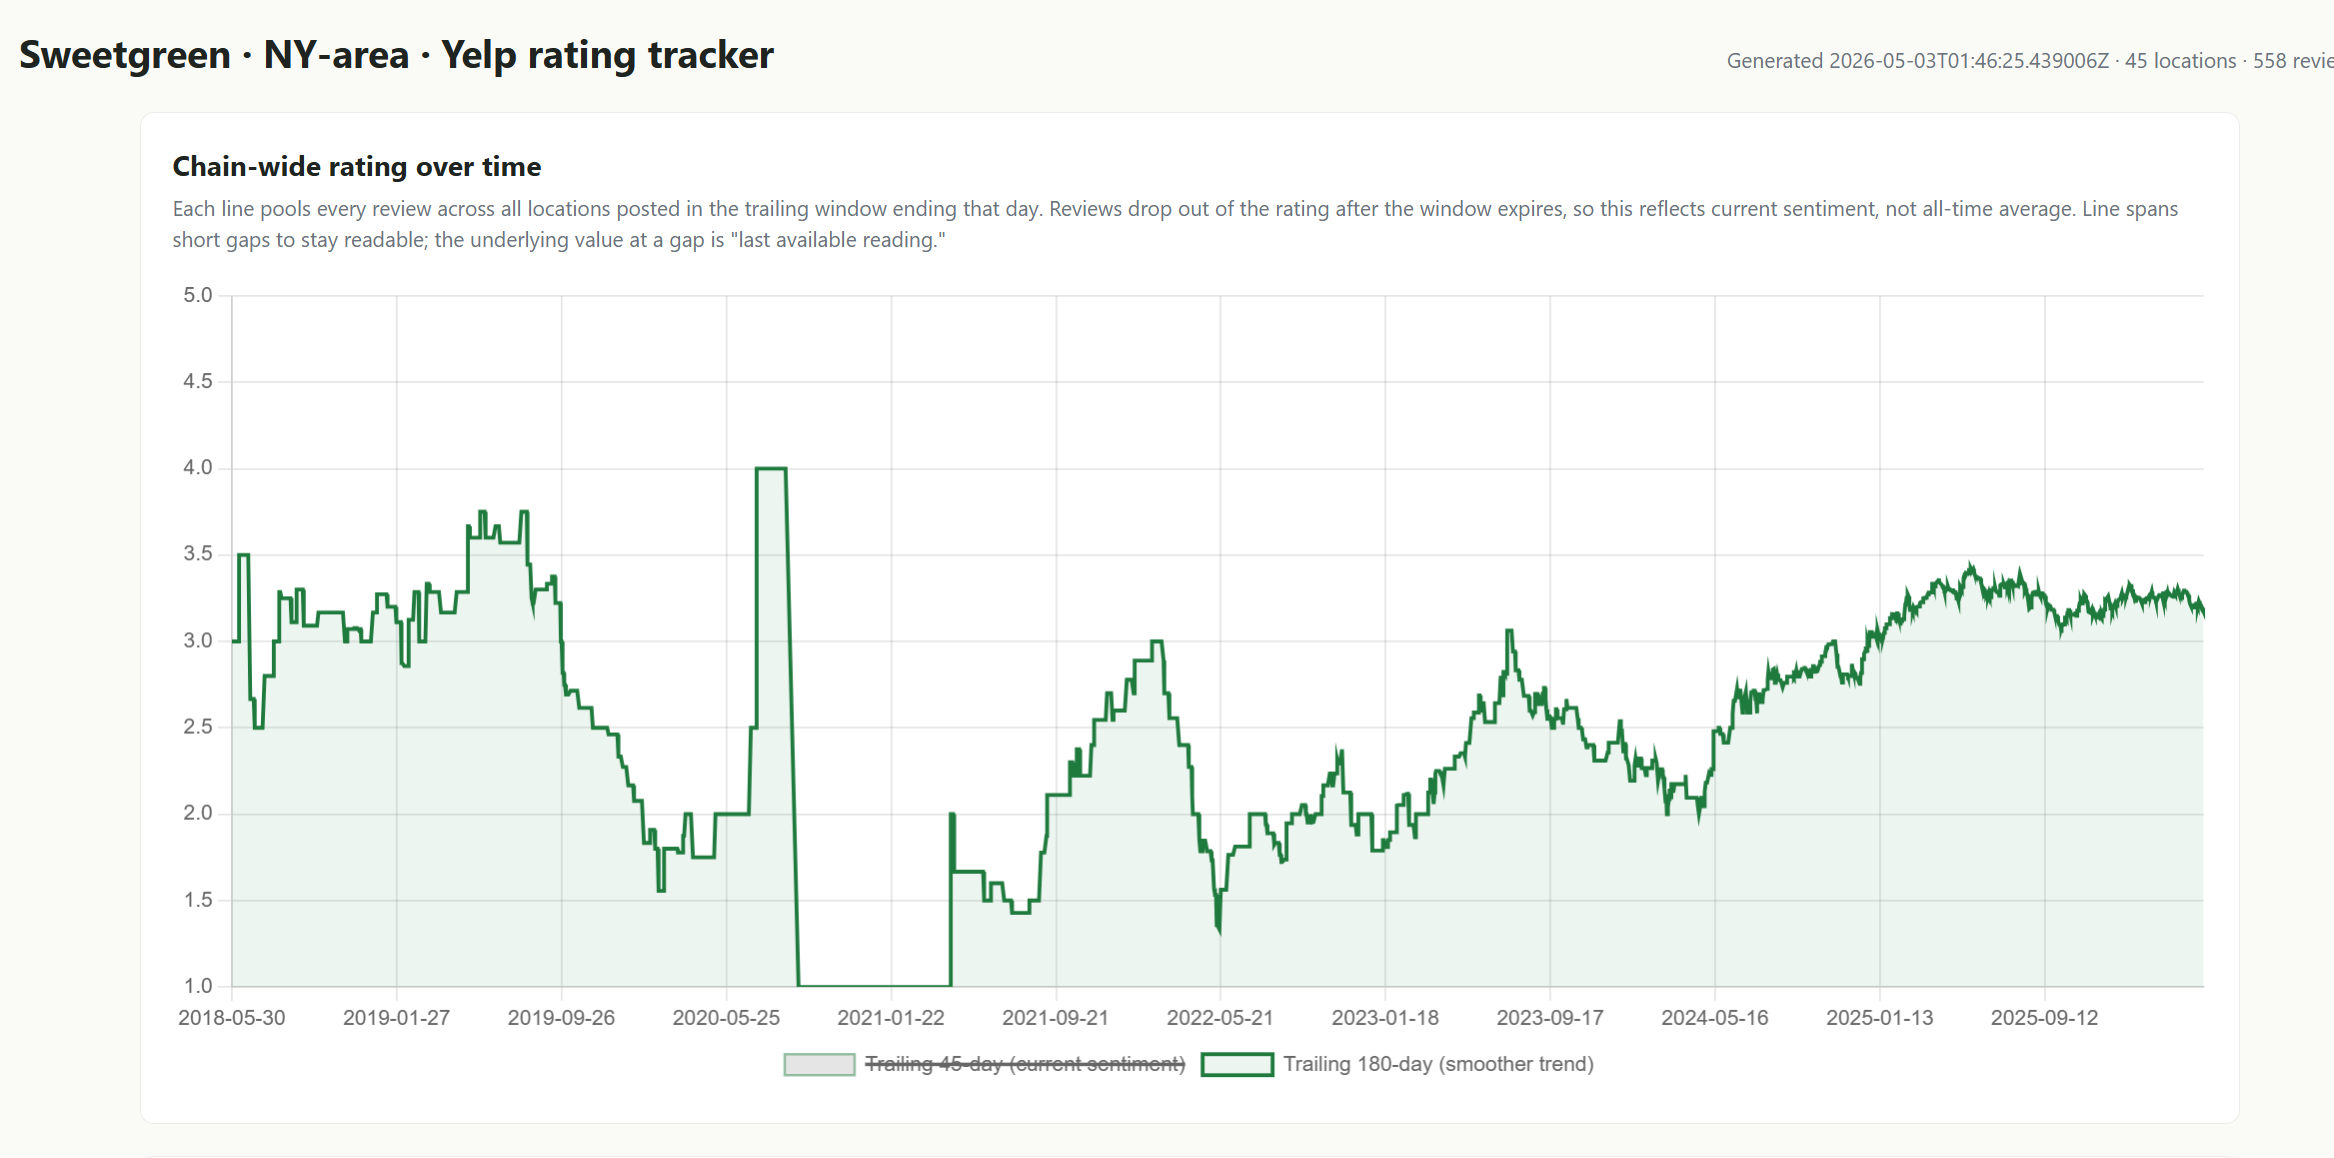
Interesting, no? The data goes back a long time (it took me a second to remember why there were no ratings in late 2020….), but you can see that the yelp data suggests my anecdote is wrong. Yelp scores bottom in the summer of 2024 and have ticked up pretty noticeably over the past year and a half.
Is this tool perfect? No, absolutely not…. but I also spent maybe an hour of my time over the course of a few days building it, and it corrected a core assumption that I had about the business. That’s wild efficiency for a minor time investment, and now I can either keep digging on Sweetgreen with one fewer concern in the back of my head, or just continue to pass on it…. but either way I'm not letting an incorrect assumption prevent me from making an investment. And, if I really wanted to dig into Sweetgreen, it’s not hard to imagine building something much more complicated that could really help with the fundamentals.
For example, maybe you want to see how Sweetgreen prices versus its closest rival. I asked the tool to do just that and price every NYC Sweetgreen versus the closest Just Salad:
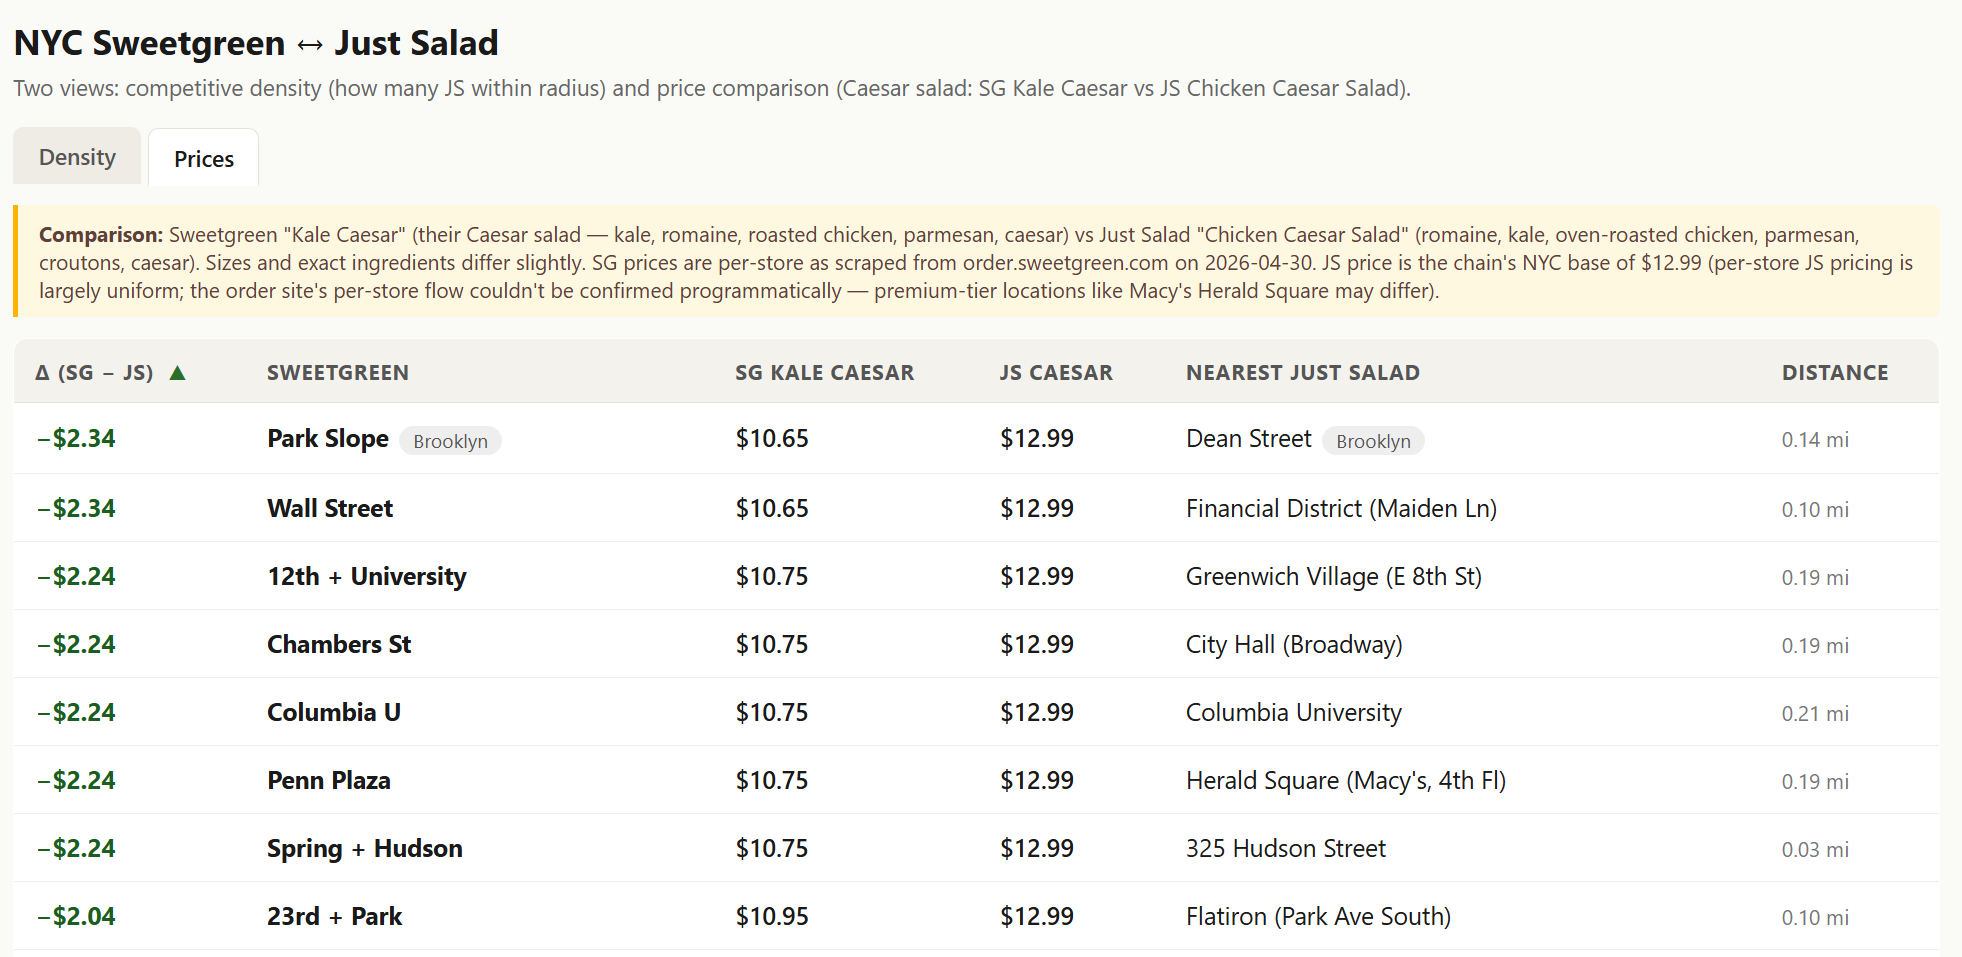
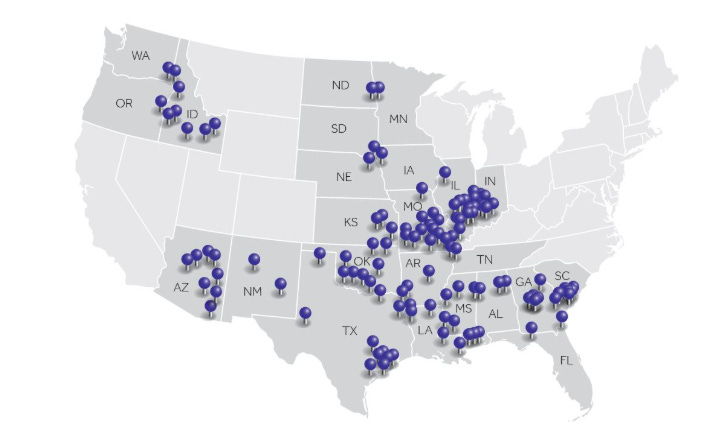
Maybe that doesn’t seem that impressive given pricing is relatively uniform across the city…. but you could do it across the country, or you could imagine how it could be very interesting in different industries. For example, consider cable, where many bulls (including me!) have far, far underestimated the competitive intensity from fiber overbuilds and FWA. Could you track them in real time? Perhaps! I took the screenshot of locations from Cable One’s 10-K
And asked Claude:
This is a screenshot of the markets Cable One operates in (from their 10-K). Could you go to each individual market, price out how much CABO is charging for broadband, and then see if there’s a fiber-to-the-home competitor in that market and, if so, what they are charging for broadband
Then I went to walk my dog. When I came back, Claude had a few clarification questions. I answered them, brushed my teeth, and came back to a spreadsheet that covered 50 CABO markets that looked like this:
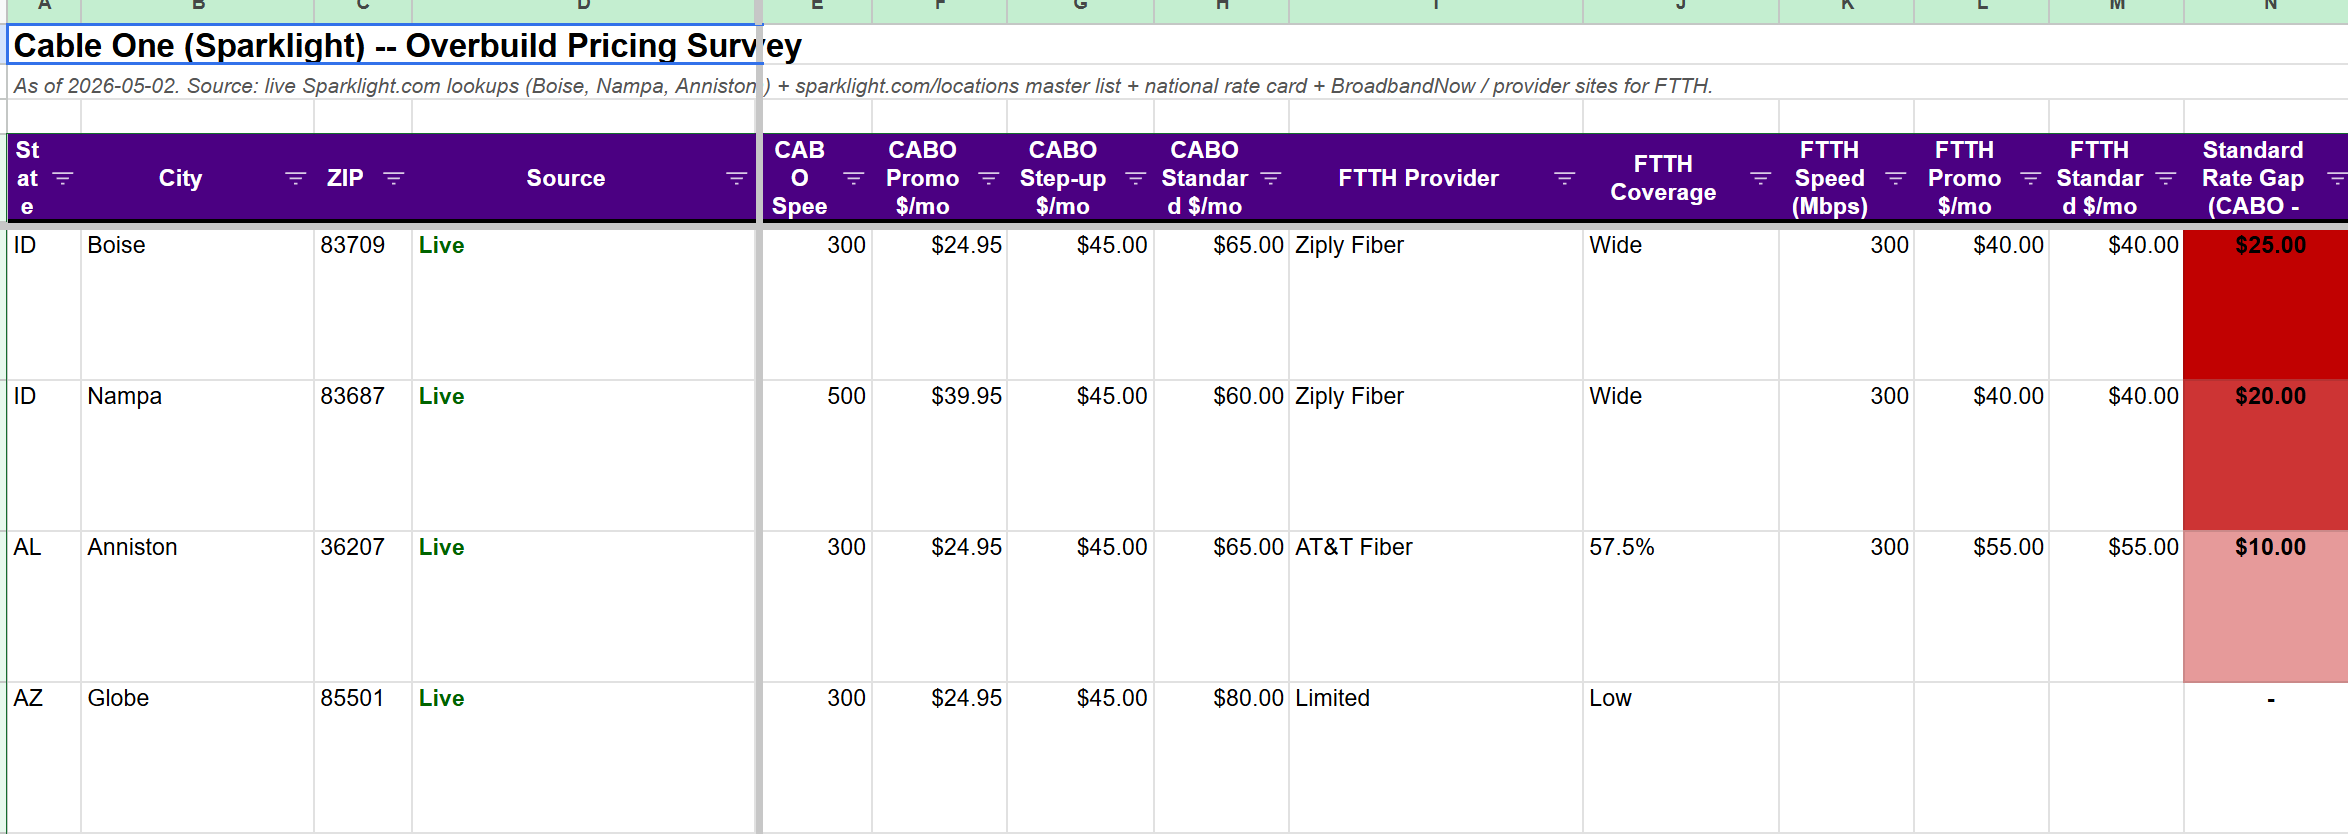
It had that info for ~50 different cities across the U.S. Here’s the summary of the overbuild counts for those markets (per Claude’s summary of this project):
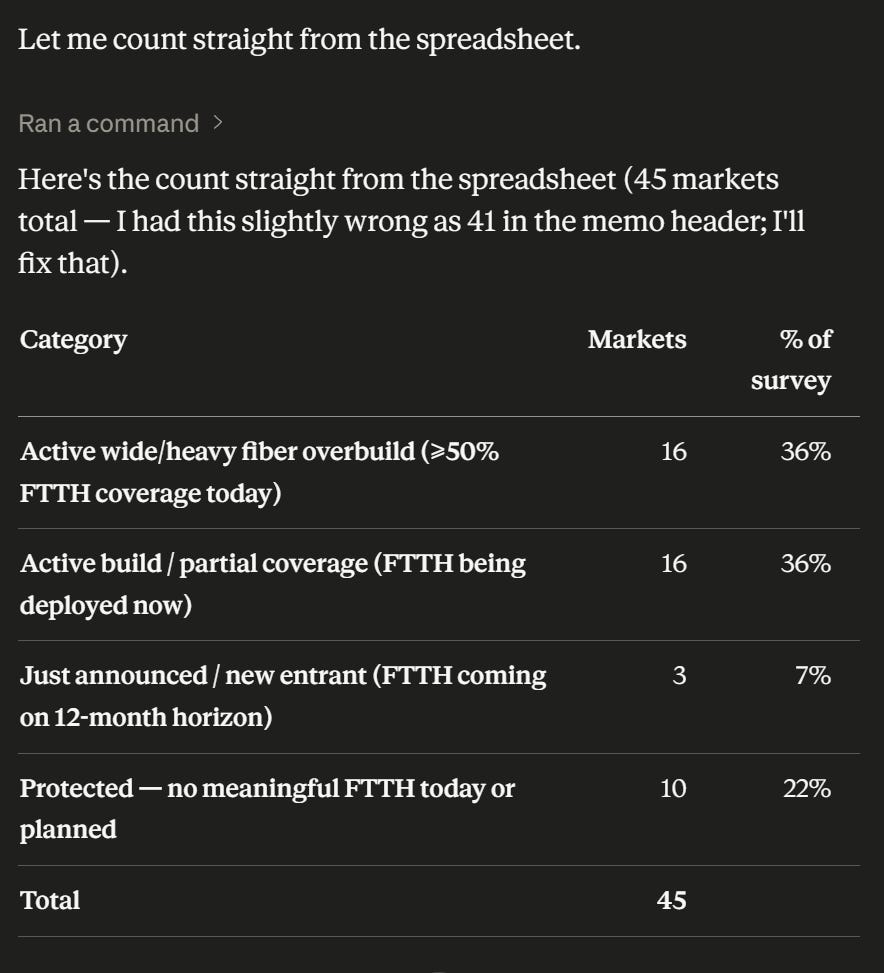
Again, it’s not perfect; if you really wanted to use it, you’d need to spend some time nudging it and cleaning up in different areas. For example, it live pulled rates for almost all of their competitors, but it pulled the national rate card for a lot of CABO markets. And you’d probably want to start pulling in FWA competition.
But, even with just a few minutes of work and nudging, the findings were striking (and confirm what any cable watcher already knows); when fiber comes into a market, prices drop substantially. Here’s some takeaways the project had for me:
“When AT&T or any other fiber overbuilder lands in a Globe-like market, the per-sub ARPU compression is potentially $25-35/mo on the gig tier (going from $105 → $70-95).”
“CABO has more standalone pricing power than I’d appreciated. The good news: more total ARPU at the top of the funnel. The bad news: more ARPU to lose as overbuild expands.”
Those takeaways make economic sense: pricing is going to be lower when you go from a local monopoly to a duopoly. But it’s devilishly hard to get market by market pricing; even sellside firms would generally only show you one or two sample markets priced versus another because pricing these markets is so tedious.
And, with a little creativity, you could imagine all sorts of creative ways you could use that info. For example, you could iterate it over time to have Claude monitor 20 different zip codes or locations in each of those cities (with ~50 cities, that’d come out to ~1k locations), and then alert you any time the pricing or promotional offers changed for any of those ~1k locations. That seems like it’d be an interesting way to monitor competitive intensity: a pick up in discount offers would likely signal some pick up in competitive intensity (new fiber overbuilder, more aggressive FWA, etc.), while price raises or a drop off in offers could signal a more “rational” pricing environment.
It's hard to overstate how crazy that is. A few months ago, monitoring 1,000 locations for real-time price cuts would have required paying a software consultancy tens of thousands of dollars a month, and the results would probably have updated weekly if you were lucky. Today, an afternoon or two of nudging CoWork gets you the same monitoring system, updating in real time, with no coding skills and the potential to keep customizing it from there.
I’ll be back early next week for part 3 (an interesting AI project I built)… that will (likely) serve as the final piece in this series. See you then!
Given how raw / rushed these tools were, I’m not going to share them publicly, but the prompts I quote in this post should get you most of the way to building your own version in an afternoon
Sweetgreen has a new wrap that they’re rolling out; I tried one for the first time yesterday and I have to say I’m tempted to go long the stock just on how tasty the wraps are!
I believe they all start in the low five figures
I just skimmed the article so perhaps I missed it, but a few thoughts...
1. Unless you have a very solid idea of what you want, tell Claude your objective and ask it to brainstorm solutions.
2. Require it to explain the rationale for its recommendations (potentially including specific references to supporting materials), identify assumptions, risks, and weaknesses.
3. Take the plan, excluding the weaknesses/risks, and plug it into another LLM and ask it to critique the plan, provide rationale, etc.
4. Iteration.
5. Especially since you lack the coding skills to understand the implementation, don't let any LLM build a tool without having reviewed and approved the design. Really, really bad idea.
6. Read #5 again.
Great to see the experimentation. Good luck!